Learn more about Bollinger Band Strategy at nextmarkets

The Bollinger Bands strategy is a statistical method used to interpret financial markets and optimise trading. If you are still unsure what trading is, be sure to read our nextmarkets “What is trading?” article before moving on to Bollinger bands.
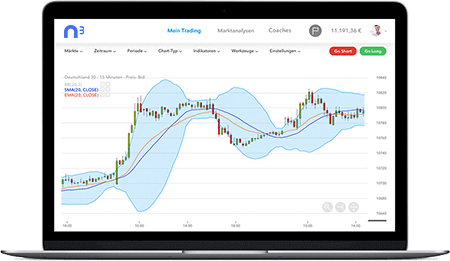
The bands are a way of visualising market data, specifically the prices of commodities or financial instruments in a given market, and their volatility. Bollinger bands take the form of a series of line graphs on a chart. This is what makes them the perfect starting place in trading for beginners when familiarising yourself with a market.

What is meant by the term Bollinger Bands?
Bollinger bands were created in the 1980s, and named after their developer John Bollinger. Since then, financial traders have been using them as one of the key methods of predicting the movement of markets in order to inform trades.
The Bollinger band strategy is instrumental in displaying the volatility of the market, which is not taken into consideration in many other market analysis tools. To put it simply, the Bollinger band strategy involves looking at a historical moving average of the market prices, and plots these on a graph over time.
These moving averages, along with a standard deviation either side, can give a great deal of information about how likely the price is to change in the immediate future. Bollinger bands can be applied to all financial markets, and are also useful for brokers and traders with CFDs. For nextmarkets top tips on CFD trading, view our guide on how to trade CFD.
Bollinger band formula
The typical method of plotting Bollinger Bands is to create a mark on a chart for a 21-day moving average of the market’s price. Two additional marks are made on the graph, one is made two standard deviations above the moving average, and another is made two standard deviations below the average.
Each of these are connected to the previous values to create three line graphs on top of each other, forming the eponymous bands. The closer together these marks, the more stable the market. The further away the marks are, and the longer the band’s shape, the more volatile the market and the more prone to change the market price. This is the guiding principle at the heart of the Bollinger band strategy, and could be a useful strategy to consider when plotting your trades on nextmarkets.
Double Bollinger band strategy on nextmarkets
The revelatory characteristic of Bollinger Bands is that they are able to give the trader more information about the behaviour of the market than a singular price average. Bollinger Bands give financial speculators indicators of when the market will move, but not where it is heading. This is why the best Forex broker should consider applying the double Bollinger band strategy while trading on their nextmarkets account.
Double Bollinger bands are calculated in exactly the same way as Bollinger bands, but they have additional markers which signal one standard deviation away from the moving average in each direction. Visually, there are now five different lines on the graph which form the bands, rather than just three.
Bollinger band strategy UK that works
One of the guiding principles of the Bollinger Band strategy is known as the squeeze. When the bands become smaller, the gap between the top and bottom values contracting to shorten the bars, this is what traders call the squeeze. While a squeeze will happen in a period of low volatility, financial traders see this as a potential indicator of high volatility on the horizon.
Market volatility is synonymous with trading opportunities in the financial world, so watching for a squeeze of the Bollinger Bands can be a sign to get ready for a trade on your nextmarkets account. When the bands begin to move wider and wider apart, this can be a sign that the market will stabilise soon, and that it’s probably a good idea to exit any trades.
Still confused about strategies and how to trade CFDs? Our nextmarkets guide to “What is CFD trading?” will clear up any questions you might have.
Fact Check
The Bollinger band strategy is primarily used as an important measure of market volatility. Likewise, it can also provide some indications to the markets here at nextmarkets, such as:
- When an upward or downward trend might be about to start
- When the market may be about to turn
- When the market is likely to stabilise at a certain price
Using double Bollinger bands on nextmarkets
The Double Bollinger bands strategy is simple, but effective. Bollinger bands are among the first indicators checked by experienced traders and in nextmarkets broker strategies across all different market types. This makes them possibly the most useful indicator of market behaviour that exists today. Double Bollinger bands can help to inform traders:
- When there is a strong enough market trend to continue riding the market
- When an existing market trend may be strong enough to enter the market
- When there is no clear trend visible in the market – prompting them to either change strategy or exit the trade
- When it is time to exit the trade, reverse the trade or cash in profits
Bollinger bands and candlesticks
Bollinger bands on their own tell us nothing about the performance of the market on a given day. For this, we need to place information about the market performance on a chart, using the bands as a backdrop. The most common place you’ll see Bollinger bands within market analysis are in the background of a candlestick chart.
Candlesticks display the open and closing price of the market, the highest and lowest prices reached during the day, and whether or not the market increased or decreased in value during that day. When plotted against Bollinger bands, suddenly traders have a context for those market prices and can make far more informed decisions about where the market might be heading.
This is where the Bollinger band strategy really becomes valuable. It’s absolutely key when learning day trading for beginners on the nextmarkets platform.
Best Bollinger band settings
The best Bollinger band settings will depend entirely on the market they are being applied to and the style of the trader using them. For example, a day trader working in the Forex market will require very different settings to a long trader buying stocks, even if both use the nextmarkets platform.
What is Forex? One of the keys to being able to use Bollinger band strategy to make successful trades is getting your settings right for you and your market. To do this, Bollinger recommends that small and incremental changes are made to the standard deviation multiplier. Large changes will throw the bands out of balance and render them useless.
Instead, Bollinger suggests making adjustments of 0.1 to the standard deviation multiplier, in line with the number of periods used to calculate the moving average. You can combine your findings with other popular day trading strategies like this one.
How does the Bollinger band scalping strategy work?
Scalping is one of the most common types of Bollinger band strategy. It works on the principle that the outer ends of the Bollinger bands indicate outlier values. If the price of the market reaches past these outer bands, the price has hit an extreme value.
Traders following Bollinger band scalping techniques would then behave as if the market is about to return to normal after having reached this extreme value. Traders need to rely on other methods, such as candlesticks or support and resistance strategies to determine when the market will make that move.
Looking for more strategies? Our nextmarkets platform provides detailed information on CFD trading strategies and Forex trading strategies.
Bollinger bands and support and resistance lines
Quite often, when looking at market charts, there will be straight lines marked near the top and the bottom of the chart. These are known as support and resistance lines and are not to be confused with Bollinger band lines.
The resistance line, also known as a market ceiling, marked by some traders as the level which the market price seems unable to break. The market price may have come close to that value at several points during the last few months, but invisible resistance pushes it back down again.
The support lines are the inverse. These mark the price which the market does not fall below, despite coming close. These support and resistance lines show the historical range of market prices and help traders to spot when the market may turn. These lines are extremely helpful at defining the outer limits of your Bollinger band strategy. For traders on nextmarkets, implementing these strategies can be simple and effortless.

Bollinger band scalping strategy on nextmarkets
The term “scalping” in financial markets refers to making very fast traders based on real-time market analysis. The idea is to make small but quick profits by buying or selling stocks, currencies or financial instruments within the space of minutes or hours.
Here, a 20-day moving average would be far too historical to be useful, so instead to use a Bollinger band scalping strategy the time periods for the moving average are condensed to show how the market is performing right now. Interested in learning more about quick trades? At nextmarkets, we’ll also help to answer questions such as “What is day trading?“.
Buy when:
- Bollinger bands are almost flat with very few ups and downs
- AND The market price touches or crosses over the lower band
Sell when:
- Bollinger bands are almost flat with very few ups and downs
- AND The market price touches or crosses over the upper band
Bollinger band breakouts
Breakouts are a key thing to look out for when following the Bollinger bands strategy. A breakout can occur after a squeeze when the Bollinger bands have come together and the market has had a period of low volatility.
If the market then closes at a price outside of the Bollinger bands, this is known as a breakout. Quite often, this might also mean that the price moves beyond one of the support or resistance lines too. A trader may decide to invest if the price breaks out above the upper Bollinger band, as this could mean the beginning of a significant upward trend.
Equally, a breakout below the bottom Bollinger band could be a good time to sell, as it may mark the start of a significant downward trend in the market price. For traders, this is an exciting time to keep a close eye on their nextmarkets account.

Did you know?
Bollinger bands are certainly not a new phenomenon. They have historical importance in financial trading and are still popular with many nextmarkets traders today.
- Bollinger bands have been instrumental in market trading since the 1980s
- John Bollinger developed his bands just a few years after purchasing his first microcomputer aged 27
- Bollinger bands have their uses outside of financial trading, and have even been applied to data from manufacturing companies to spot defects in patterned fabrics
Bollinger band analysis
One of the best ways of getting to grips with the Bollinger band strategy is to have a look at past trades where you already know the outcome, and look for indicators in the historical data leading up to the trade. This Bollinger band analysis is vital when learning to read the markets. Take some trades which you know to have been successful, and look at market charts to see what the Bollinger bands were doing in the lead up to that trade.
Once you are comfortable with some of the patterns you see, take some trades on nextmarkets which you know to have been unsuccessful, and compare the behaviour of the bands. Analysing these past trades will help you to to become familiar with these indicators, and how they might be used to inform trading behaviour.
Bollinger band calculations
There are several calculations which are absolutely vital when implementing Bollinger band strategy on your nextmarkets account. For each day of market trading, there are three Bollinger band calculations which need to be performed:
- Middle – the 20-day simple moving average of the price of the market
- Upper – The middle value + ( a 20-day standard deviation in price x 2)
- Lower – the middle value – (a 20-day standard deviation in price x 2)
For double Bollinger band strategy, two further calculations are required:
- S1 upper -The middle value + ( a 20-day standard deviation in price)
- S1 lower – The middle value – ( a 20-day standard deviation in price)
These calculations are all that you need to plot to create the Bollinger band chart for any given market.
Double Bollinger band rules
The reason that the Bollinger band strategy is so widely used by traders across all markets and on the nextmarkets platform, is due to the simple actionable insights which traders can follow at a simple glance of these lines. The easiest way to use this method is by following these double Bollinger band rules:
Buy when:
The market price sits between the top two Bollinger band lines (this implies that there is a strong upward trend which is likely to continue).
Sell when:
The market price sits between the bottom two Bollinger band lines (this implies that there is a strong downward trend which is likely to continue).
Exit when:
The price sits within the middle bands, up to one standard deviation above and below the moving average line (this implies that there is no strong trend, so it is almost impossible to tell where the market is heading).

Advanced Bollinger band strategies with nextmarkets
Bollinger band strategy is one of the simplest methods of statistically evaluating the market. They are the perfect entry-level tool for novice traders, and they also serve people who want to make quick decisions about when to enter and exit a market. Once you know the patterns to look for, they’re incredibly easy to read.
Use the basic Bollinger bands strategy to seek out opportunities, but then apply more complicated and sophisticated tools to calculate how much to trade and when exactly to do it. These can easily be applied through nextmarkets.
Counter-trending with Bollinger bands
Counter-trending is a trading methodology which assumes that the current market trend will reverse at some point. It’s important for nextmarket traders to be aware of this methodology, as it can be implemented into your personal trading strategy. Some traders liken it to betting on black on roulette after a string of red numbers has been called. It is a strategy adopted over the medium term, and Bollinger band strategy is often key to getting it right. Overall, Bollinger bands are reasonably accurate at describing where the direction of the market reverses.
Trading against the current trend can be very profitable, as it is possible to cash in on the new trend right at the beginning before the rest of the market catches up. This is of course also a risky strategy, as there is no guarantee that the market will turn when you think it may do. Risk management strategies are therefore vital when adopting this use of Bollinger band strategy.

Bollinger bands overview on nextmarkets
The Bollinger bands strategy is a perfect place to start for novice traders, especially within forex trading for beginners. It’s very simple to understand, from the calculations through to reading the charts for insights and opportunities.
Although an understanding of the Bollinger band strategy will not ensure that your trades are completely foolproof, they will certainly allow you to get your trades off the ground and to begin investing smartly. Open a nextmarkets account today and see for yourself whether the Bollinger bands strategy works for you.
- Forex fibonacci trading strategy
- Best forex scalping strategy
- Forex trading strategy - Best forex strategy 2023
- Scalping Strategy
- Donchian Channel Strategy
- Momentum Trading Strategies
- Best swing trading strategy
- Hedging Strategies
- Trading Tips and Strategies
- Best Day Trading Strategy 2023
- Forex trading strategy for beginners
- CFD Trading Strategies